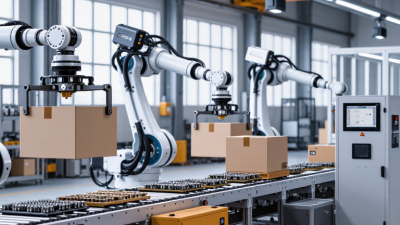
Automated packaging systems can turn a crowded production floor into a steady, measurable workflow. A carton moves beneath a filler. A sensor checks its position. A sealer closes the flaps, while a label printer marks each finished pack. Small details matter. A poorly matched conveyor can slow the whole line, even when the main machine runs quickly.
Packaging scholar Dr. Laura Bix’s research offers a useful reminder: packaging must be considered through protection, usability, and production needs. That perspective helps frame this guide’s comparison. The best system is not always the fastest or most expensive. It should fit the product, package format, available floor space, staffing, and expected production volume. A compact tabletop unit may suit short runs, while a robotic palletizer can handle repetitive end-of-line work. There are trade-offs.
This guide explores the top 10 automated packaging systems, from filling and wrapping equipment to case packing and palletizing solutions. Each type serves a different purpose. Some reduce repetitive handling; others improve consistency or support faster changeovers. Results depend on setup, maintenance, and operator training, so automation is not a magic fix. Use the overview to compare capabilities, identify practical constraints, and prepare better questions for equipment suppliers.
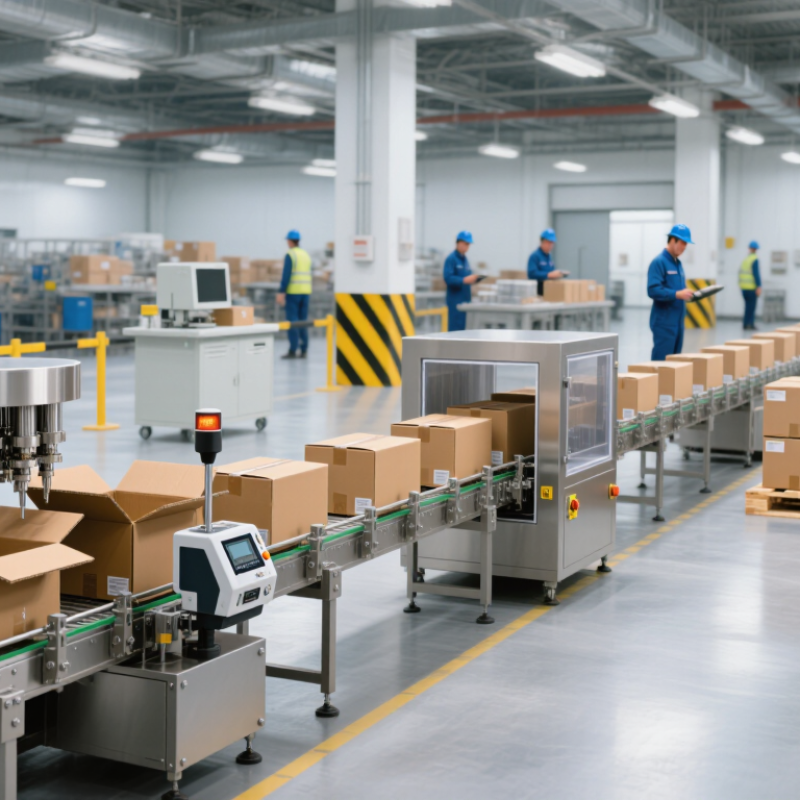
An automated packaging system is best defined by the work it performs, not by a machine list. Its core functions move products into position, form or supply packaging, fill or place products, close packs, inspect results, and prepare units for shipment. A line may also add labels, print codes, group packs, or build pallets. Not every installation needs every function.
Boundaries matter. A practical scope might begin where products enter a controlled infeed and end when wrapped pallets are ready for warehouse transfer. Between those points, operators should identify who supplies packaging materials, handles rejects, and responds to jams. These details sound minor. They often decide whether equipment integrates cleanly. The boundary can be imperfect, especially when existing conveyors or manual checks remain in place.
Industry data helps explain the wider automation context, but should not be misread as packaging-specific. The International Federation of Robotics’ World Robotics 2024 report recorded 541,302 industrial robot installations worldwide in 2023 and an operational stock of 4.28 million. Those figures cover many industries, not packaging lines alone. They show automation’s scale, while leaving each facility to define its actual line endpoints, safety interfaces, and performance measures. A useful specification names each function, its input and output, and the handoff to the next station. That is less tidy than a machine count, but more useful.
Automated packaging systems cover distinct stages, from incoming containers to finished cases. A depalletizer removes empty bottles or cans from stacked layers, while a palletizer builds stable loads at the line’s exit. Case erectors form flat blanks into open cartons. Case packers then place products inside, using robotic arms or guided mechanical lanes. These machines must match product size, case design, and required line speed.
Fillers dispense measured liquids, powders, or granules into containers. Cappers apply and tighten closures; uneven torque can cause leaks or damage. Labelers position printed information on curved or flat surfaces, where small alignment errors are easy to spot. Sealers close bags, cartons, or trays using heat, pressure, or adhesive. Checkweighers flag packages outside a set weight range, while vision inspection systems detect issues such as missing labels or crooked caps. Details matter.
A conveyor system connects these machines and controls product flow between them. It may seem simple, but poor spacing can create jams or leave equipment waiting. Operators should test the full line with real containers and packaging materials, not just ideal samples. Changeovers take time. A highly automated setup can still need careful adjustment, especially when packaging dimensions vary slightly between batches.
Ten common systems shown in a typical packaging-line sequence
How to read this chart: The horizontal bars show typical process order, not machine speed, capacity, or a performance ranking. Actual line layouts vary by product and package; rinsing, inspection, and other steps may be optional.
An 85% OEE benchmark can help compare automated packaging systems, but it is not a universal promise. OEE combines availability, performance, and quality, so a fast machine may still score poorly when minor stoppages or rejected packs accumulate. A cartoner rated for 200 cartons per minute might deliver less during a shift with frequent jams. The gap matters.
Compare systems under the same conditions. Record good units per operating hour, changeover minutes, and losses from startup scrap. A filling line may sustain high throughput on one container size but need longer adjustments when formats change. Case packers and palletizers can also become bottlenecks if upstream speeds rise. Keep the benchmark in view, not in charge. Real shifts are messier. Product variation, operator experience, and maintenance routines all affect results. Even the cleanest comparison has a weak spot: planned production time may be defined differently across facilities. Use measured shift data, document assumptions, and test changeovers with the actual products and packaging materials.
Automated packaging systems can move cartons, seal cases, and palletize loads with little operator contact. Yet changeovers, jam clearing, and cleaning bring people close to moving parts. ISO 12100 provides a framework for identifying hazards, estimating risk, and reducing it through design, safeguards, and information. ISO 13849-1 helps engineers specify and assess safety-related control systems. The standards serve different purposes; applying one does not replace the other.
The U.S. Bureau of Labor Statistics reported 2.8 recordable injury and illness cases per 100 full-time workers in manufacturing in 2023. This is a sector-wide rate, not a packaging-machine statistic, but it underlines why safe access matters. A practical assessment follows the real task: a hand reaching into a carton former, a technician opening a guard, or a worker clearing a jam. Small gaps matter. A checklist alone can miss them.
For each safety function, define the required performance level, or PLr, through risk assessment, then verify that the selected control architecture and components can achieve it under ISO 13849-1. Test interlocks, emergency stops, and restart behavior on the installed line, including after a changeover. Record assumptions and validation results. A rushed assessment may overlook unusual cleaning routines; that is a useful reason to revisit the analysis with operators, not a reason to pretend the first review was complete.
Automated packaging is not one machine; it is a line built around a product and its pack format. The ten common options include weigh fillers, auger fillers, liquid fillers, form-fill-seal machines, flow wrappers, tray sealers, cartoners, case packers, labelers, and palletizers. Fit comes first. A dusty powder may need a contained auger filler, while fragile pastries benefit from gentle handling and a flow wrapper. A machine that runs quickly but damages products is not productive.
Pack format narrows the choice. Decide whether the product needs a pouch, bottle, tray, carton, or case, then check changeover time and material compatibility. Ask suppliers to run your actual product and packaging, not just a similar sample. Watch for spills, jams, seal quality, and how often operators must intervene. Then test it. A short demonstration may not reveal problems that appear after several hours.
Capacity should reflect real demand, including peak shifts and planned growth, rather than a best-case speed on a specification sheet. Compare labor, utilities, maintenance, spare parts, training, packaging waste, and downtime when estimating total cost of ownership. I would leave some room in the budget for adjustments; forecasts are rarely perfect. A lower purchase price can become expensive if format changes require long stops or specialist support. The right choice depends on measured performance, serviceability, and the costs your team can verify.
| Automated System | Best-Fit Products | Common Pack Format | Indicative Capacity | Key Total Cost of Ownership Factors |
|---|---|---|---|---|
| Vertical form-fill-seal (VFFS) | Powders, granules, snacks, coffee, and other free-flowing products | Pillow bags, gusseted bags, and block-bottom bags | Approximately 20–200 bags per minute | Film usage and sealing requirements; dosing equipment; changeover time; product giveaway; cleaning and maintenance needs |
| Horizontal flow wrapping (HFFS) | Bars, baked goods, produce, and regularly shaped individual items | Fin-seal or lap-seal flow-wrap packs | Approximately 30–300 packs per minute | Film cost; product feeding and spacing; sealing-jaw wear; format changeovers; handling of fragile or irregular products |
| Thermoform-fill-seal | Fresh foods, prepared meals, cheese, and products requiring a rigid or semi-rigid pack | Formed trays or cavities with lidding film; optional vacuum or modified-atmosphere packaging | Approximately 5–20 cycles per minute; packs per cycle depend on tooling | Forming and lidding material cost; tooling; vacuum or gas requirements; sanitation; mold changeovers and maintenance |
| Automatic filling and capping | Liquids, sauces, oils, personal-care products, and compatible dry products | Bottles or jars with screw, snap, or pump closures | Approximately 30–300 containers per minute | Number of filling heads; product viscosity and foaming; change parts; cleaning time; cap and container handling; fill accuracy |
| Automatic cartoning | Bottles, tubes, blister packs, sachets, and grouped consumer products | Pre-glued cartons; tuck-end or other carton styles | Approximately 30–200 cartons per minute | Carton material and loading method; leaflet or insert handling; changeover complexity; reject rates; operator and maintenance requirements |
| Automatic labeling | Bottles, jars, cans, tubs, and cases with flat or curved surfaces | Pressure-sensitive labels, wraparound labels, or sleeves | Approximately 30–300 containers per minute | Label and liner waste; application accuracy; container orientation; sensor and applicator maintenance; label changeovers |
| Automatic case packing | Cartons, bottles, cans, pouches, and individually wrapped products | Products loaded into corrugated cases or trays | Approximately 5–30 cases per minute | Product collating and loading style; case dimensions; tooling; line integration; changeover time; compressed-air and power demand |
| Case erecting and sealing | Secondary-packaging lines using regular corrugated cases | Knocked-down cases erected, filled downstream, and sealed with tape or adhesive | Approximately 8–30 cases per minute per machine | Case-board quality and consistency; tape or adhesive consumption; case-size range; jam frequency; access for clearing and maintenance |
| Automated palletizing | Sealed cases, trays, and other stable secondary packs | Stacked layers on pallets, with optional slip sheets or stretch wrapping | Approximately 10–40 cases per minute, depending on load and stacking pattern | Robot or layer-handling configuration; pallet and slip-sheet handling; safety equipment; floor space; end-of-line integration and service |
| Shrink bundling and multipacking | Cans, bottles, cartons, and other products sold in grouped quantities | Shrink-film multipacks, with or without a tray | Approximately 5–30 bundles per minute | Film consumption; heat and energy use; pack stability; bundle configuration changes; shrink-tunnel maintenance and ventilation |
Capacity note: These are indicative operating ranges, not guaranteed outputs. Actual throughput depends on product characteristics, pack dimensions, equipment configuration, feeding method, changeovers, and required quality checks. Compare total cost of ownership over the expected service life, including materials, labor, utilities, maintenance, downtime, and integration.