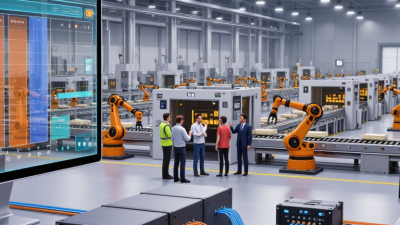
Choosing the right industrial automation solutions is not simply a matter of buying faster machines. It means matching technology to production goals, workforce skills, safety needs, and the realities of existing equipment. The International Federation of Robotics reported 4,281,585 industrial robots operating in factories worldwide in 2023, with 541,302 new installations that year (World Robotics 2024). Those figures show the scale of adoption, but they do not prove that every factory needs a robot. A small packaging line and a high-volume automotive plant face very different problems.
Investment expectations are rising, too. Deloitte’s 2024 Smart Manufacturing Survey found that 86% of surveyed manufacturers expect smart manufacturing to be a primary driver of competitiveness within five years. That is a strong signal, not a guarantee of return. A sensor on a noisy production line can generate data all day; without a clear use for it, the data may add little value. Fit matters more.
This guide looks at how to assess automation opportunities, compare vendors, and plan integration around measurable outcomes. Key questions include whether a solution can work with legacy machinery, whether staff can maintain it, and how downtime will be handled during installation. Readers should also examine total cost, cybersecurity, scalability, and support—not just the quoted purchase price. A polished demonstration can hide awkward maintenance or workflow changes. Even careful planning misses things. The aim is a practical decision framework, grounded in reported industry evidence and attentive to the details that determine whether automation works on the factory floor.
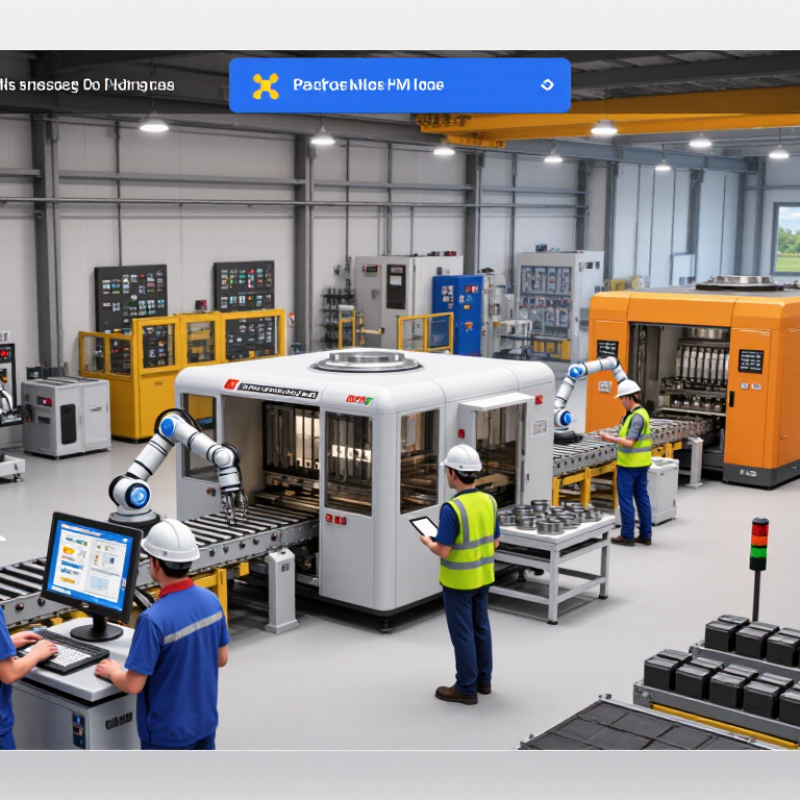
Define the operational problem before selecting equipment. Start with the constraint. Is the line losing time to changeovers, missed inspections, manual handling, or unstable cycle times? Record baseline throughput, scrap, unplanned downtime, labor exposure, and energy use across representative shifts.
The International Federation of Robotics’ World Robotics 2024 reports 4,281,585 industrial robots operating worldwide in 2023, up 10% year over year. That scale signals maturity, not a reason to automate every task.
Set one measurable target, such as reducing changeover time by 15%, then mark where the process begins and ends. The International Energy Agency’s Energy Efficiency 2023 report estimates industry used about 37% of global final energy in 2022. Track energy, too.
Draw the scope around the full workflow, not just one machine. Map material arrival, operator decisions, control systems, safety interlocks, quality checks, and downstream handoffs. Keep exceptions visible: a robot may improve a steady pick cycle while complicating replenishment.
IFR recorded 541,302 new industrial robot installations in 2023, but installation figures do not prove local returns. Specify which tasks stay manual, what data must be reliable, and who handles maintenance and recovery after a fault.
Measure a pilot across normal and peak shifts. Be honest about weak data. A rushed baseline is common, and it can hide losses or make a sound project look disappointing. Revisit the scope when real operating conditions challenge the original assumptions.
Before selecting industrial automation solutions, map how work actually moves through the facility. Record cycle times, changeovers, stoppages, scrap, and manual handoffs across representative shifts. A polished process map can hide a ten-minute jam at a conveyor sensor. Watch the line in operation. Ask operators where they use workarounds, then compare their accounts with maintenance logs and production records.
Equipment condition matters as much as equipment age. Note controller types, available interfaces, sensor coverage, and whether critical machines can share reliable signals. The International Federation of Robotics reported 4,281,585 industrial robots operating worldwide in 2023, up 10% year over year. That growth shows automation is expanding, but it does not mean every site is ready to connect systems. An older machine may still provide useful data; a newer one may leave gaps.
Check data readiness before specifying dashboards or machine-learning tools. Are timestamps synchronized? Do teams use consistent units and product codes? How often are readings missing, delayed, or manually corrected? Test a small sample against what operators see on the floor. A spreadsheet may disagree with the production screen. That’s worth investigating. Data quality is easy to overestimate when nobody checks how records are created, corrected, and maintained.
Illustrative readiness assessment for a mid-sized discrete manufacturing site. Values are example measurements; validate them against actual production records before making investment decisions.
| Assessment area | Indicator | Current state | Readiness | Assessment and next step |
|---|---|---|---|---|
| Process | Standard work coverage | 70% of production steps have documented work instructions | Moderate | Document and validate the remaining steps before automating variable tasks. |
| Process | Production scheduling and changeovers | Average changeover: 38 minutes; frequent schedule changes | Moderate | Establish baseline changeover procedures and define rules for production sequencing. |
| Process | Unplanned downtime tracking | Downtime recorded manually; reason codes used in 60% of events | Needs improvement | Standardize downtime categories and capture event start, end, and cause consistently. |
| Equipment | Machine control and interface access | 12 of 15 critical machines have accessible control data | Moderate | Inventory control interfaces and confirm safe, supported data access for each machine. |
| Equipment | Equipment availability | Average monthly availability: 91% across critical assets | Moderate | Review recurring failures and maintenance history before adding automated capacity. |
| Equipment | Safety and operating condition | Risk assessments are current for 13 of 15 critical machines | Moderate | Complete outstanding risk assessments and verify safeguarding before equipment changes. |
| Data | Production data availability | Output is entered by shift; scrap and cycle-time data are incomplete | Needs improvement | Define required production fields and automate collection where reliable signals exist. |
| Data | Timestamp and data quality | Clock synchronization is inconsistent; approximately 8% of sampled records have missing fields | Needs improvement | Synchronize system clocks and set validation rules for completeness and acceptable ranges. |
| Data | Network and cybersecurity controls | Production network is segmented; remote-access review is documented quarterly | Good foundation | Preserve network segmentation and include access, backup, and recovery requirements in solution design. |
| Implementation | Staff capability and ownership | Maintenance and operations leads are identified; training plan is not yet defined | Moderate | Assign process and system owners, then prepare role-based training and support plans. |
Suggested priority: Improve downtime and production-data quality first, confirm machine interfaces and safety, then pilot automation on a stable, well-understood process.
Choosing industrial automation is less about buying the newest technology and more about how well it fits the line. A programmable logic controller suits repeatable machine sequences; a programmable automation controller can combine motion, process control, and data handling. Machine vision helps inspect labels or detect defects, but lighting, product variation, and cycle time affect results. Small details matter. Compare response time, expansion capacity, operator skills, and maintenance requirements against the actual job.
Compatibility deserves a physical check. Match controller inputs and outputs to existing sensors, voltage levels, and actuators. Confirm that communication protocols work across machines, supervisory systems, and data platforms. For example, a new vision station may identify a missing cap, yet still fail to stop the conveyor if its signals cannot reach the line controller reliably. Test real-time performance, safety functions, and recovery after a network interruption. A spreadsheet rarely catches every mismatch.
Industry data makes careful planning more relevant. The International Federation of Robotics reported 541,302 industrial robot installations worldwide in 2023, up 10% from 2022, in its World Robotics 2024 report. That growth does not mean every factory needs a robot. It does reinforce the value of checking integration before committing capital. Pilot the proposed setup on one representative machine, document downtime and changeover results, and involve technicians who will maintain it. I would still leave room for surprises: legacy equipment often behaves differently from its drawings.
Safety should be assessed against the actual work, not just a product checklist. Map operator tasks, maintenance access, moving parts, and restart procedures before comparing systems. Ask how sensors, guards, and emergency stops behave during faults. A short site trial can reveal awkward reach distances or unclear alerts that drawings miss. Small details matter. No setup removes every risk, so document remaining hazards and review them with the people who will run the equipment.
Scalability means more than adding machines later. Check whether the control architecture can handle extra production lines, data points, and changes in product mix without a full redesign. Test a realistic growth scenario, such as adding one shift or a packaging station. Then estimate lifecycle costs, including integration, training, spare parts, energy use, and planned downtime. The cheapest initial quote may not stay cheapest. A tidy spreadsheet can still hide assumptions about installation hours or future upgrades; challenge those figures.
Supplier support affects recovery when equipment stops at 2 a.m. Confirm response hours, remote troubleshooting limits, local service coverage, spare-part lead times, and training options. Ask for a sample escalation process and references from facilities with similar operating conditions. Put service expectations in writing, where possible. Also notice how clearly the supplier explains constraints. If every answer sounds effortless, ask again; real systems have trade-offs, and honest answers are more useful than polished promises.
Compare safety, scalability, total cost of ownership, and supplier support using a consistent 1–5 rating scale.
Illustrative project-planning scores, not industry benchmarks. Rate each criterion against your site requirements, lifecycle costs, and supplier commitments before making a decision.
Choosing industrial automation starts with a map of the work, not a catalogue of equipment. Trace one product from sensor to controller, operator screen, and production record. Mark where data changes format or arrives late. Start on paper.
86% Deloitte’s 2024 Smart Manufacturing and Operations Survey found that 86% of surveyed manufacturing executives expect smart manufacturing solutions to drive competitiveness over the next five years. That expectation is not a reason to automate every step. Connect only the systems needed to solve a measurable problem, such as repeated manual entry or unexplained stoppages.
Before installation, define acceptance tests with operators and maintenance staff. Check normal production, rejected parts, network interruptions, and safe-stop behavior. Record cycle time, scrap, and downtime before and after commissioning; otherwise, improvement is mostly a claim.
Keep the test boring. During the first weeks, compare machine logs with shift notes, because timestamps and reason codes are often inconsistent. That gap matters.
Review the results monthly, assign one owner to each corrective action, and retest after changes. An imperfect baseline is still useful, but document its limits rather than polishing the numbers. Automation needs adjustment after real shifts, not just a successful factory test.